The Cup and Handle Pattern is a widely recognized formation in technical analysis, signaling potential bullish momentum. This pattern provides traders with valuable insights into market psychology and can help identify high-probability trade setups. Whether you’re a beginner or an experienced trader, understanding how to spot and utilize this pattern can improve your trading strategy.
What is the Cup and Handle Pattern?
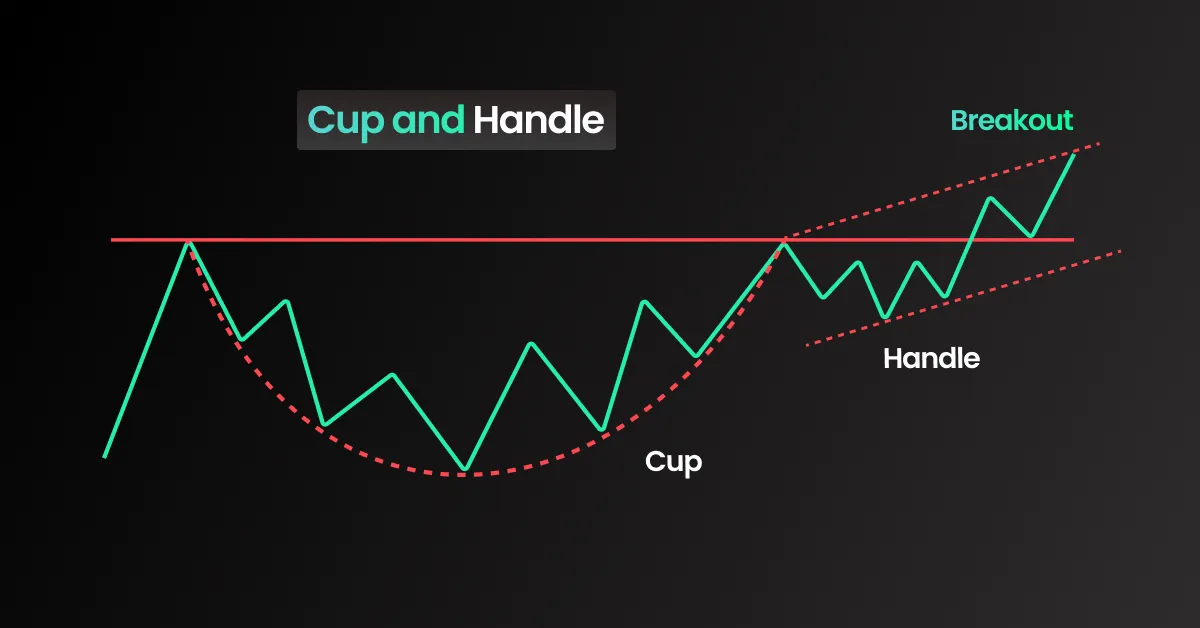
The Cup and Handle Pattern is a chart formation that resembles a teacup, consisting of two main parts:
- Cup: A rounded bottom formation that indicates a gradual shift from bearish sentiment to bullish momentum.
- Handle: A slight consolidation or downward retracement following the cup before a breakout occurs.
This pattern is considered a bullish continuation signal, meaning it typically forms in an uptrend and signals further upward movement.
Understanding the Formation of the Cup and Handle
- The Cup Formation
- The cup takes shape as the market experiences a downward trend followed by a slow recovery.
- It usually forms a rounded bottom, resembling a U-shape rather than a sharp V-reversal.
- The rounded nature of the cup indicates a stabilization of price and a gradual shift from bearish to bullish sentiment.
- The Handle Formation
- Once the cup is formed, a handle appears as a slight downward consolidation.
- This handle represents traders taking profits before a potential breakout.
- The handle should ideally be smaller than the cup, typically retracing no more than one-third of the cup’s rise.
- Breakout and Confirmation
- A breakout occurs when the price moves above the resistance level formed at the top of the cup.
- Increased trading volume during the breakout confirms strong bullish sentiment.
- Once the breakout is confirmed, traders anticipate a continued uptrend.
Key Characteristics of the Cup and Handle Pattern
- Timeframe: The pattern can form over several weeks to months, making it suitable for medium- to long-term traders.
- Volume: A decrease in volume during the cup formation followed by an increase at the breakout confirms the pattern.
- Price Target: The expected price movement after a breakout is usually equivalent to the depth of the cup added to the breakout point.
How Traders Use the Cup and Handle Pattern
- Identifying Potential Entry Points
- Traders look for the breakout above the handle’s resistance level as a buying signal.
- Some traders enter before the breakout in anticipation of the pattern’s completion.
- Setting Stop-Loss Orders
- A stop-loss is typically placed below the lowest point of the handle to manage risk.
- If the pattern fails, this ensures minimal losses.
- Calculating the Price Target
- Measure the distance from the bottom of the cup to the resistance level.
- Add this distance to the breakout point to estimate the potential price target.
Limitations of the Cup and Handle Pattern
While the Cup and Handle Pattern is a reliable signal, it has some limitations:
- False Breakouts: Sometimes, price breaks above resistance but fails to sustain momentum.
- Handle Depth: If the handle is too deep, it may indicate weakness rather than consolidation.
- Market Conditions: Works best in strong uptrending markets but can fail in choppy or bearish conditions.
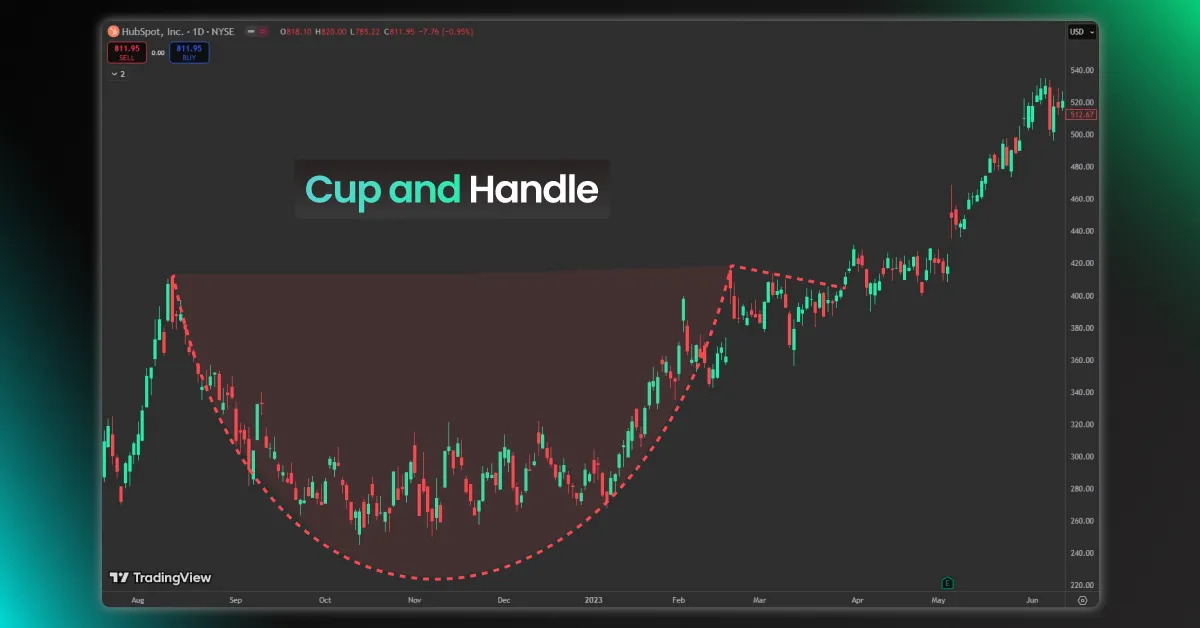
Examples of Cup and Handle Pattern in Trading
This pattern can be found in various financial markets, including stocks, forex, and cryptocurrencies. Traders often use technical indicators like moving averages, RSI, and MACD to confirm breakout strength.
Conclusion: Mastering the Cup and Handle Pattern
The Cup and Handle Pattern is a powerful tool in technical analysis, helping traders identify potential bullish continuations. By understanding how it forms, recognizing breakouts, and managing risks effectively, traders can use this pattern to enhance their trading decisions.
For more educational trading resources, check out our trading tips category and start refining your strategy today!

