In financial markets, traders constantly look for reliable chart patterns to enhance their strategies. Among the most effective bullish continuation patterns is the bull flag pattern. This formation signals brief consolidation within an uptrend, providing opportunities for traders to enter strong momentum moves at optimal points.
Understanding how to identify, confirm, and trade bull flags can significantly improve trade timing and profitability. In this guide, we explore the bull flag pattern, its characteristics, and how traders use it to their advantage.
What is a Bull Flag Pattern?
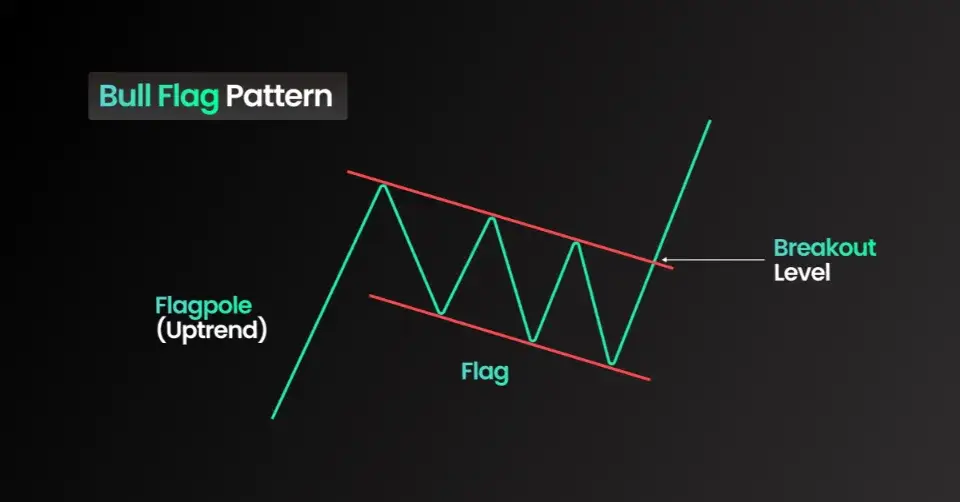
A bull flag is a technical chart pattern that signals a continuation of an existing uptrend after a brief consolidation period. The pattern consists of two primary components:
- The Flagpole: A strong and rapid price movement upward, indicating initial bullish momentum.
- The Flag: A small, downward-sloping consolidation or sideways movement that follows the flagpole.
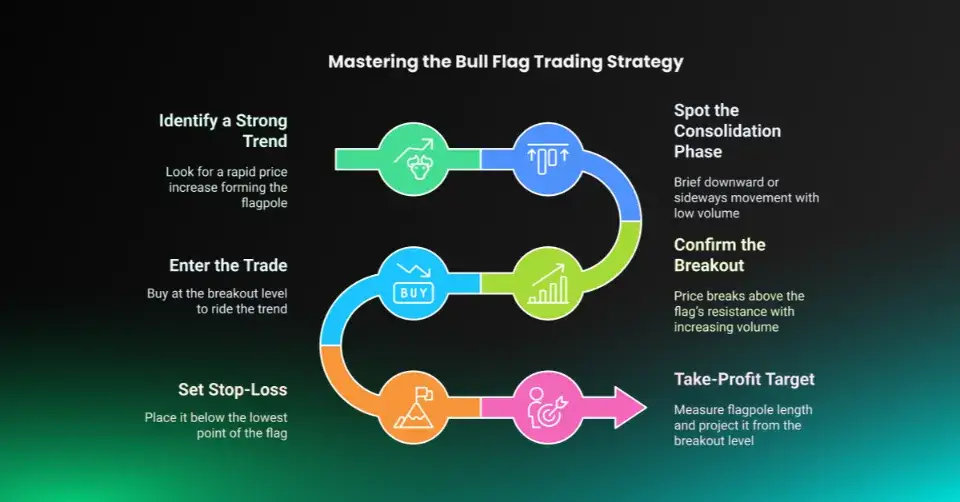
Once the consolidation phase ends, the price typically breaks out above resistance, continuing the prior uptrend. The bull flag breakout confirms that buyers remain in control, increasing the probability of further upward movement.
Key Features of a Bull Flag
A valid bull flag pattern exhibits the following characteristics:
✔ Sharp Price Rally (Flagpole): A strong initial uptrend before consolidation.
✔ Lower Volume During Consolidation: A decline in volume during the formation of the flag.
✔ Flag Formation (Downward Channel or Sideways Range): Price movement within parallel or converging lines.
✔ Breakout with High Volume: A strong upward move beyond resistance confirms the bull flag.
Bull flags typically appear within trending markets and are used by both short-term and long-term traders to enter positions with a favorable risk-to-reward ratio.
Bull Flag vs. Bear Flag
While bull flags signal a continuation of an uptrend, the bear flag pattern represents a continuation of a downtrend. The table below highlights their key differences:
For example, if the flagpole is $10 in length, the price target after breakout would be $10 above the resistance level.
Common Mistakes When Trading Bull Flags
Despite its reliability, traders sometimes make mistakes when executing bull flag trades:
🚫 Entering Too Early: A breakout must be confirmed before entering.
🚫 Ignoring Volume: A low-volume breakout is likely a false signal.
🚫 Trading Weak Trends: The bull flag is most effective in strong markets.
🚫 Placing Stops Too Close: Stops too tight can result in premature exits.
Avoid these errors by following proper risk management and confirming breakout signals.
Final Thoughts on the Bull Flag Pattern
The bull flag pattern is one of the most reliable trading formations for spotting trend continuation opportunities. By identifying high-quality setups, traders can enter positions with confidence and minimize risk.
Understanding the flagpole, consolidation phase, and breakout confirmation is crucial to executing successful trades. Whether you are a day trader, swing trader, or long-term investor, mastering the bull flag pattern can improve your trading performance.
To enhance your strategy:
- Look for strong momentum preceding the flag formation.
- Ensure that the breakout is accompanied by high volume.
- Use proper stop-loss and take-profit placement.
By applying these principles, traders can capitalize on bullish momentum and improve their win rate in trending markets.
FAQ for Bull Flag Pattern
1. What does a bull flag mean?
A bull flag is a bullish continuation pattern that appears after a strong price rally, followed by a brief consolidation phase. It signals that the uptrend is likely to resume after the price breaks out of the consolidation zone. The pattern consists of a flagpole (sharp upward move) and a flag (slightly downward or sideways movement) before a breakout.
2. What is the psychology behind the bull flag?
The bull flag pattern reflects market psychology, where traders take profits after a strong rally, causing a temporary pullback (the flag). However, the trend remains strong as buyers re-enter at lower prices, leading to a breakout. The pattern suggests that bullish momentum is still intact, and the pause is a healthy consolidation before the next move higher.
3. How long can a bull flag last?
A bull flag typically lasts a few days to a few weeks, depending on the timeframe of the market. In short-term trading (intraday or swing trading), the flag may form over several hours or days. In long-term trading (stocks, forex, or crypto investments), the flag can take weeks or even months to complete. The key is that the consolidation phase remains proportionate to the flagpole.
