Candlestick trading is a fundamental technique in technical analysis, helping traders interpret market sentiment and predict price movements. These visually distinctive chart patterns provide insights into potential trend reversals, continuations, and market momentum. Understanding candlestick formations can significantly improve decision-making, whether you’re trading forex, stocks, or cryptocurrencies.
What Is Candlestick Trading?
Candlestick trading involves analyzing price action using candlestick charts, which represent an asset’s open, high, low, and close prices within a specific timeframe. Each candlestick provides valuable information about market psychology, indicating whether buyers or sellers are in control.
A candlestick consists of three main components:
- The Body: Represents the difference between the opening and closing price.
- The Wick (Shadow): The thin lines extending above and below the body, indicating the highest and lowest price levels.
- The Color: A bullish candle (often green or white) forms when the closing price is higher than the opening price, while a bearish candle (red or black) forms when the closing price is lower than the opening price.
By identifying patterns formed by multiple candlesticks, traders can anticipate potential market movements and adjust their strategies accordingly.
Why Candlestick Patterns Matter in Trading
Candlestick patterns provide a visual representation of price action and investor sentiment. Traders use them to identify entry and exit points, detect reversals, and confirm trends. The reliability of these patterns increases when combined with other technical indicators like support and resistance levels, moving averages, and volume analysis.
- Bullish Reversal Patterns: Indicate a potential shift from a downtrend to an uptrend.
- Bearish Reversal Patterns: Signal a possible transition from an uptrend to a downtrend.
- Continuation Patterns: Suggest that the current trend will likely continue.
Let’s explore the most important candlestick patterns every trader should know

1. Doji
A Doji occurs when an asset’s opening and closing prices are almost identical, resulting in a small body with long wicks. This pattern represents market indecision, where buyers and sellers are evenly matched.
- Significance: A Doji may signal a potential reversal when appearing after a strong trend.
- Variations:
- Neutral Doji: Equal wicks on both sides indicate complete indecision.
- Dragonfly Doji: A long lower wick suggests bullish potential.
- Gravestone Doji: A long upper wick hints at bearish pressure.
2. Hammer and Inverted Hammer
The Hammer is a bullish reversal pattern that appears after a downtrend, featuring a small body with a long lower wick.
- Meaning: The long wick indicates that sellers pushed the price lower, but buyers regained control by the close.
- Confirmation: A strong bullish candle after the Hammer reinforces the trend reversal.
The Inverted Hammer is similar but has a long upper wick and signals potential reversal after a downtrend.
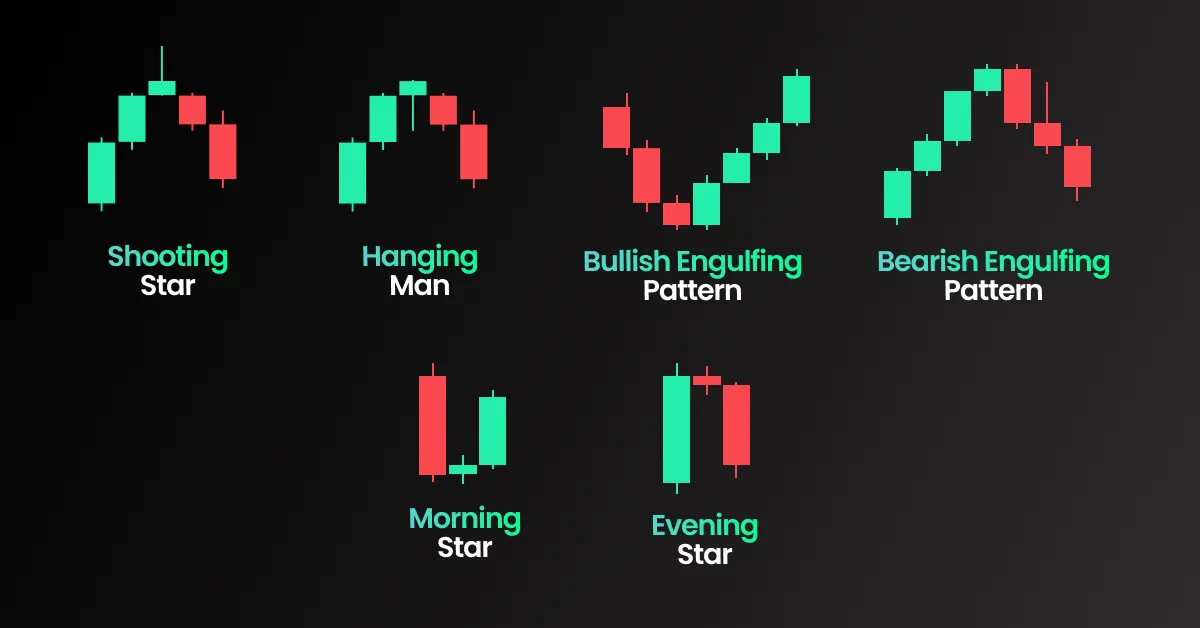
3. Shooting Star and Hanging Man
The Shooting Star is a bearish reversal pattern that appears after an uptrend, characterized by a small body and a long upper wick.
- Meaning: The pattern suggests that buyers attempted to push the price higher but faced strong resistance from sellers.
- Confirmation: A downward candle following the Shooting Star strengthens the bearish signal.
The Hanging Man is the bearish counterpart of the Hammer and signals potential downward movement after an uptrend.
4. Bullish and Bearish Engulfing Patterns
The Bullish Engulfing pattern forms when a large bullish candle completely engulfs the previous bearish candle, signaling a strong buying momentum.
- Key Insight: The pattern suggests that bulls have regained control, often leading to an upward move.
- Best Use Case: Works best near support levels, confirming a potential reversal.
The Bearish Engulfing pattern is the opposite, where a large bearish candle engulfs the previous bullish candle, indicating increased selling pressure.
5. Morning Star and Evening Star
The Morning Star is a bullish three-candle pattern indicating a reversal from a downtrend to an uptrend.
- Formation:
- The first candle is bearish, continuing the downtrend.
- The second candle is a small-bodied candle, signaling indecision.
- The third candle is bullish, confirming the reversal.
The Evening Star follows the opposite pattern and signals a bearish reversal.

6. Three White Soldiers and Three Black Crows
The Three White Soldiers pattern consists of three consecutive bullish candles with small wicks, suggesting strong upward momentum.
- Implication: Indicates sustained buying pressure and trend continuation.
Conversely, Three Black Crows features three successive bearish candles, hinting at a strong downtrend.
7. Marubozu
A Marubozu candlestick lacks wicks and has a long body, showing decisive market direction.
- Bullish Marubozu: A full-bodied green candle signals strong buying interest.
- Bearish Marubozu: A full-bodied red candle suggests dominant selling pressure.
Conclusion: Mastering Candlestick TradingMor
Understanding candlestick trading is crucial for reading market sentiment and making informed trading decisions. These patterns offer traders valuable clues about potential price reversals and trend continuations.
For more insights, visit our trading tips and start refining your candlestick analysis today!
Summary of Key Candlestick Patterns

