Best Indicators for Identifying Divergence
To spot divergence effectively, traders use momentum-based indicators, such as:
1. Relative Strength Index (RSI)
The RSI measures momentum and overbought/oversold conditions. Divergence between RSI and price action helps traders confirm trend changes.
2. Moving Average Convergence Divergence (MACD)
The MACD histogram and signal line provide valuable divergence signals, showing whether bullish or bearish momentum is fading.
3. Stochastic Oscillator
Stochastic divergence helps identify potential reversals, particularly in ranging markets.
4. Commodity Channel Index (CCI)
The CCI is useful for identifying price exhaustion and divergence in high-volatility markets.
How to Trade Divergence Effectively
To trade divergence successfully, follow these steps:
1. Identify the Divergence Type
Determine if it’s a regular divergence (reversal) or hidden divergence (continuation).
2. Confirm with Multiple Indicators
Use RSI, MACD, or Stochastic Oscillator to confirm signals. A single divergence signal without confirmation can lead to false trades.
3. Use Trendlines & Support/Resistance
Confirm divergence signals using trendlines and key support/resistance levels.
4. Look for Candlestick Confirmation
Wait for bullish or bearish candlestick patterns (e.g., hammer, engulfing, or shooting star) before entering a trade.
5. Set a Stop-Loss & Profit Target
Manage risk by:
- Stop-loss below the most recent swing low (for bullish trades) or swing high (for bearish trades).
- Profit targets at key resistance/support levels or a 1:2 risk-to-reward ratio.
Common Mistakes When Trading Divergence
🚫 Ignoring Market Context: Always consider the overall trend before taking trades based on divergence.
🚫 Forcing Divergence: Not every small price difference is a true divergence—focus on clear and obvious signals.
🚫 Not Waiting for Confirmation: Entering a trade too early without candlestick confirmation can result in losses.
🚫 Trading Divergence in Sideways Markets: Divergence works best in trending rather than choppy or ranging markets.
Final Thoughts on Divergence in Trading
Divergence is a valuable tool for traders looking to spot trend reversals and continuations in the market. Whether you use RSI, MACD, or Stochastic Oscillator, recognizing divergence can provide high-probability trading setups.
📌 Key Takeaways:
✔ Regular divergence signals reversals, while hidden divergence signals trend continuation.
✔ Confirm divergence with indicators, trendlines, and candlestick patterns.
✔ Avoid false signals by using proper risk management and stop-loss strategies.
By mastering divergence trading, traders can enhance accuracy, reduce risks, and capitalize on profitable market movements.
FAQ for Divergence in Trading
1. What is divergence in trading?
Divergence in trading occurs when the price of an asset moves in one direction while a momentum indicator (such as RSI or MACD) moves in the opposite direction. This suggests a potential trend reversal or continuation, helping traders identify trading opportunities.
2. What are the two main types of divergence?
There are two main types of divergence in trading:
- Regular Divergence: Indicates a potential trend reversal. A bullish divergence occurs when the price makes lower lows while the indicator makes higher lows, signaling a possible upward move. A bearish divergence happens when the price makes higher highs while the indicator makes lower highs, suggesting a downtrend.
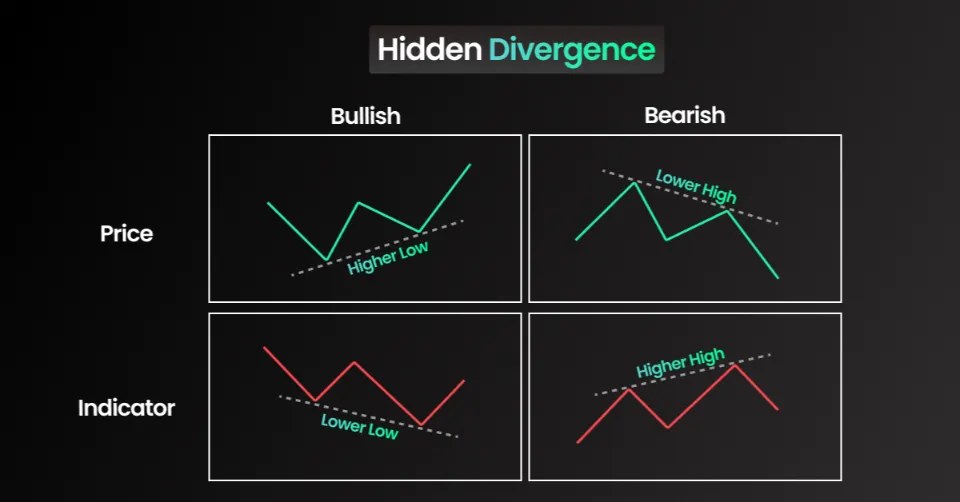
- Hidden Divergence: Signals trend continuation. A hidden bullish divergence occurs when the price makes higher lows while the indicator makes lower lows, confirming an uptrend. A hidden bearish divergence happens when the price makes lower highs while the indicator makes higher highs, confirming a downtrend.
3. How do you trade divergence?
To trade divergence effectively:
- Identify divergence using RSI, MACD, or Stochastic Oscillator.
- Confirm the pattern with trendlines, support/resistance levels, and candlestick formations.
- Use volume indicators to check for momentum confirmation.
- Place stop-loss orders to manage risk and protect against false signals.
- Set a profit target based on the length of the previous price movement or key resistance/support levels.
4. Which indicator is best for divergence trading?
The most commonly used indicators for spotting divergence include:
- Relative Strength Index (RSI) – Helps detect overbought and oversold conditions, useful for identifying divergence.
- Moving Average Convergence Divergence (MACD) – Shows momentum shifts and confirms trend reversals.
- Stochastic Oscillator – Measures price momentum, useful in identifying divergence in ranging markets.
- Commodity Channel Index (CCI) – Detects overbought/oversold conditions and trend strength.
5. Can divergence be a false signal?
Yes, divergence can produce false signals, especially in ranging or low-volatility markets. To avoid false signals:
- Always wait for confirmation through price action (e.g., candlestick patterns like engulfing or pin bars).
- Use trendline analysis to validate potential breakouts.
- Consider trading volume—a strong breakout with high volume increases reliability.
- Avoid low-liquidity assets, as they tend to produce unreliable divergence signals.