You’ve mastered the basics of the Wyckoff Method—understanding market cycles, the three laws, and the 5-step approach to trading. But what if you could take your skills to the next level, pinpointing entries and exits with surgical precision? The Wyckoff Method offers advanced techniques that let experienced traders decode the market’s most subtle signals, from hidden accumulation patterns to deceptive reversals. In this guide, we’ll explore how to use Wyckoff schematics, spot springs and upthrusts, leverage volume analysis, and integrate modern tools to enhance your trading. Whether you’re aiming to pass a Tradexprop evaluation or manage a funded account, these strategies will help you trade like “smart money.” Ready to elevate your game? Let’s dive into the advanced world of Wyckoff trading!
What Are Advanced Wyckoff Strategies?
Quick Definition: Advanced Wyckoff Strategies
Advanced Wyckoff strategies are techniques that use detailed price and volume analysis, Wyckoff schematics, and specific patterns like springs and upthrusts to time trades with precision.
Advanced Wyckoff strategies go beyond the basics of identifying accumulation and distribution phases. They focus on the nuances of market behavior, helping traders anticipate moves before they happen. These techniques involve analyzing Wyckoff schematics—detailed templates of accumulation and distribution phases—along with specific price patterns like springs (false breakdowns) and upthrusts (false breakouts). By combining these patterns with volume analysis and modern tools, traders can align their trades more closely with institutional activity, often called “smart money.” For example, spotting a spring in an accumulation phase can signal a low-risk buying opportunity just before a markup begins.
Quick Definition: Advanced Wyckoff Strategies
Advanced Wyckoff strategies are techniques that use detailed price and volume analysis, Wyckoff schematics, and specific patterns like springs and upthrusts to time trades with precision.r proprietary traders, such as those in Tradexprop evaluations, where precision can mean the difference between passing and failing. Let’s break down the key techniques to master.
Understanding Wyckoff Schematics: Accumulation and Distribution in Detail
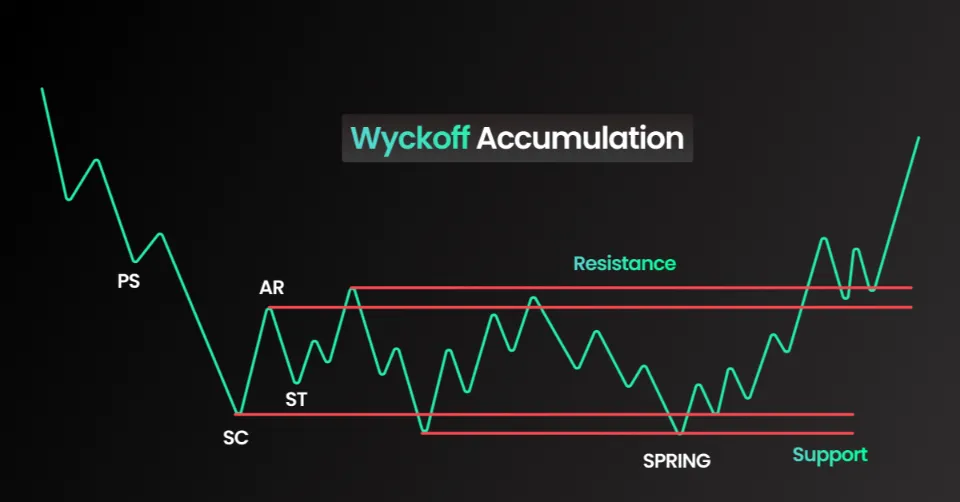
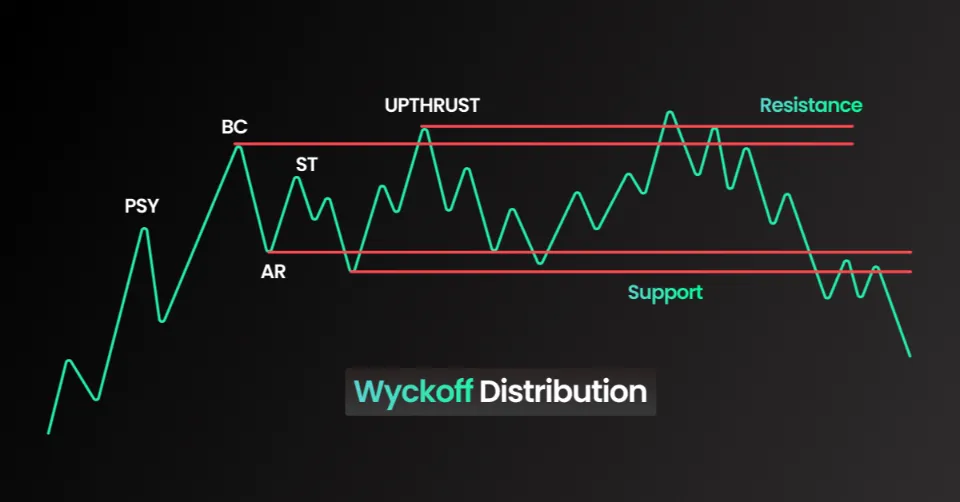
Wyckoff schematics are detailed frameworks that map out the stages of accumulation (buying) and distribution (selling) phases, helping traders identify critical turning points. Each schematic includes specific events that signal smart money’s intentions. Here’s a breakdown of the two main schematics:
- Accumulation Schematic:
- Preliminary Support (PS): Smart money starts buying after a downtrend, often on high volume, halting the decline.
- Selling Climax (SC): A sharp drop on heavy volume as retail traders panic-sell, allowing smart money to absorb shares.
- Automatic Rally (AR): A bounce after the selling climax as selling pressure eases, often on lower volume.
- Secondary Test (ST): Price revisits the selling climax area to test for remaining supply, usually on lower volume—a sign of absorption.
- Spring: A false breakdown below support, designed to shake out weak hands, followed by a quick reversal. This is a key buying signal.
- Test and Breakout: Price tests the range’s upper resistance, then breaks out on increasing volume, marking the start of the markup phase.
- Distribution Schematic:
- Preliminary Supply (PSY): Smart money starts selling after an uptrend, often on high volume, slowing the rally.
- Buying Climax (BC): A sharp spike on heavy volume as retail traders buy in, allowing smart money to offload positions.
- Automatic Reaction (AR): A pullback after the buying climax as buying pressure fades, often on lower volume.
- Secondary Test (ST): Price revisits the buying climax area to test for remaining demand, usually on lower volume—a sign of distribution.
- Upthrust: A false breakout above resistance, designed to trap late buyers, followed by a quick reversal. This is a key selling signal.
- Test and Breakdown: Price tests the range’s lower support, then breaks down on increasing volume, marking the start of the markdown phase.
For example, in a Tradexprop evaluation with a $100,000 account, spotting a spring in an accumulation schematic for EUR/USD (e.g., a false breakdown below 1.0500 followed by a rally) could signal a low-risk buy, helping you stay within the 8% max drawdown ($8,000) while targeting a markup to 1.0800.
Spotting Springs and Upthrusts: Timing Entries and Exits
Springs and upthrusts are two of Wyckoff’s most powerful patterns for timing trades. They exploit the market’s tendency to trap retail traders before reversing. Here’s how to identify and trade them:
- Springs (Accumulation):
- What It Looks Like: Price briefly breaks below the support of an accumulation range (e.g., 1.0500 for EUR/USD), then quickly reverses back into the range on increasing volume.
- Why It Happens: Smart money triggers stop-losses below support to buy at lower prices, shaking out weak hands before the markup.
- How to Trade It: Buy on the reversal back into the range, with a stop-loss below the spring’s low. For example, if EUR/USD springs at 1.0480 and reverses to 1.0520, buy at 1.0520 with a stop at 1.0470, targeting the range’s upper resistance (e.g., 1.0600).
- Upthrusts (Distribution):
- What It Looks Like: Price briefly breaks above the resistance of a distribution range (e.g., 1.1100 for EUR/USD), then quickly reverses back into the range on increasing volume.
- Why It Happens: Smart money triggers buy orders above resistance to sell at higher prices, trapping late buyers before the markdown.
- How to Trade It: Sell or short on the reversal back into the range, with a stop-loss above the upthrust’s high. For example, if EUR/USD upthrusts to 1.1120 and reverses to 1.1080, sell at 1.1080 with a stop at 1.1130, targeting the range’s lower support (e.g., 1.1000).
These patterns are especially useful in Tradexprop evaluations, where avoiding large drawdowns is critical. A well-timed spring trade can help you capture a markup while keeping risk tight.
Using Volume Analysis to Confirm Wyckoff Patterns
Volume is the heartbeat of the Wyckoff Method, revealing whether price movements are driven by smart money or retail traders. Here’s how to use volume analysis to confirm Wyckoff patterns:
- High Volume on Breakouts: A breakout from an accumulation range (e.g., above 1.0600 for EUR/USD) on high volume confirms smart money is driving the markup. Low volume on a breakout suggests a false move—be cautious.
- Low Volume on Tests: During a secondary test in accumulation, decreasing volume indicates supply is drying up, a bullish sign. For example, if EUR/USD tests 1.0500 after a selling climax and volume drops, it’s a sign of absorption.
- Volume Divergence: In distribution, if price makes a new high (e.g., 1.1120) but volume decreases, it signals weak demand—an upthrust may follow. This divergence often precedes a markdown.
- Volume Spikes on Reversals: A spring or upthrust often sees a volume spike on the reversal, confirming smart money’s involvement. For instance, a spring at 1.0480 with a volume spike on the rally back to 1.0520 is a strong buy signal.
For Tradexprop traders, volume analysis can help you avoid false breakouts that might push you beyond the 8% drawdown limit ($8,000 on a $100k account). Always check volume to validate your Wyckoff setups.
Integrating Modern Tools with the Wyckoff Method
While the Wyckoff Method is timeless, modern tools can enhance its effectiveness, especially in fast-moving markets like forex. Here are three ways to integrate contemporary tools:
- Order Flow Analysis: Use order flow tools to see real-time buying and selling pressure, confirming Wyckoff patterns. For example, heavy buying at a spring’s low (e.g., 1.0480) can validate your entry.
- Volume Profile: This tool shows volume at different price levels, helping you identify key support and resistance zones within accumulation or distribution ranges. A high volume node at 1.0500 in an accumulation range for EUR/USD might confirm a strong support level.
- Heatmaps: Currency heatmaps can highlight strength or weakness across pairs, helping you select assets in harmony with the trend (Step 2 of Wyckoff’s 5-step approach). If the USD is weakening across the board, a markup in EUR/USD is more likely.
Combining these tools with Wyckoff’s principles can give you an edge, especially in Tradexprop evaluations where precision is key to staying within drawdown limits.
Advanced Wyckoff Trading Example: A Tradexprop Scenario
Let’s apply these advanced strategies to a Tradexprop evaluation with a $100,000 account and an 8% max drawdown ($8,000). You’re trading GBP/USD, which has been in an accumulation range between 1.2600 and 1.2700 for weeks. Here’s how you use Wyckoff:
- Step 1: Analyze the Schematic: You identify a selling climax at 1.2600 (high volume, sharp drop), followed by an automatic rally to 1.2700 and a secondary test at 1.2620 on lower volume—classic accumulation signs.
- Step 2: Spot a Spring: Price briefly dips to 1.2580 (below support) on low volume, then reverses to 1.2620 with a volume spike—a spring.
- Step 3: Confirm with Volume: The reversal shows increasing volume, and a volume profile confirms strong support at 1.2600.
- Step 4: Time Your Entry: You buy at 1.2620, with a stop-loss at 1.2570 (below the spring’s low, risking $500 or 0.5% of your account). You target 1.2900, the range’s projected move based on P&F charts (a $2,800 potential profit).
- Step 5: Monitor the Markup: GBP/USD breaks above 1.2700 on high volume, confirming the markup. You exit at 1.2880 when volume spikes but price stalls, signaling potential distribution—locking in a $2,600 profit while staying well within Tradexprop’s drawdown limit.
This trade demonstrates how advanced Wyckoff strategies can help you achieve precision while managing risk in a prop trading environment.
FAQ: Advanced Questions About the Wyckoff Method
- What’s the difference between a spring and a shakeout?
A spring is a false breakdown below support in an accumulation range, often on low volume, followed by a quick reversal. A shakeout is a larger, more aggressive drop designed to scare out weak hands, typically seen in broader market corrections.
- How can I avoid false Wyckoff signals?
Use volume analysis to confirm patterns—low volume on a breakout or reversal often signals a trap. Also, wait for confirmation, like a test after a spring, before entering.
- Can I combine Wyckoff with other strategies?
Yes! Wyckoff pairs well with support/resistance levels, Fibonacci retracements, or moving averages to confirm trends and key levels. Check our trading tips for more ideas.


