
Recognizing chart patterns is a vital skill for traders aiming to refine their technical analysis. These patterns appear repeatedly in price charts, offering insights into potential market movements. Whether you’re new to trading or have years of experience, understanding these key formations can enhance your trading decisions.
What Are Trading Chart Patterns?
Chart patterns are recurring price formations that indicate potential trend continuations or reversals. They serve as a crucial part of technical analysis, allowing traders to predict market behavior by analyzing past price actions. Identifying these patterns can provide traders with an edge in making informed trading choices.
Types of Chart Patterns
Chart patterns generally fall into three main categories:
- Continuation Patterns: Suggest that the current trend will persist after a brief consolidation phase.
- Reversal Patterns: Indicate that an existing trend is likely to change direction.
- Bilateral Patterns: Signal that the market may break out in either direction due to increased volatility.
Now, let’s explore the 11 key chart patterns every trader should be aware of.
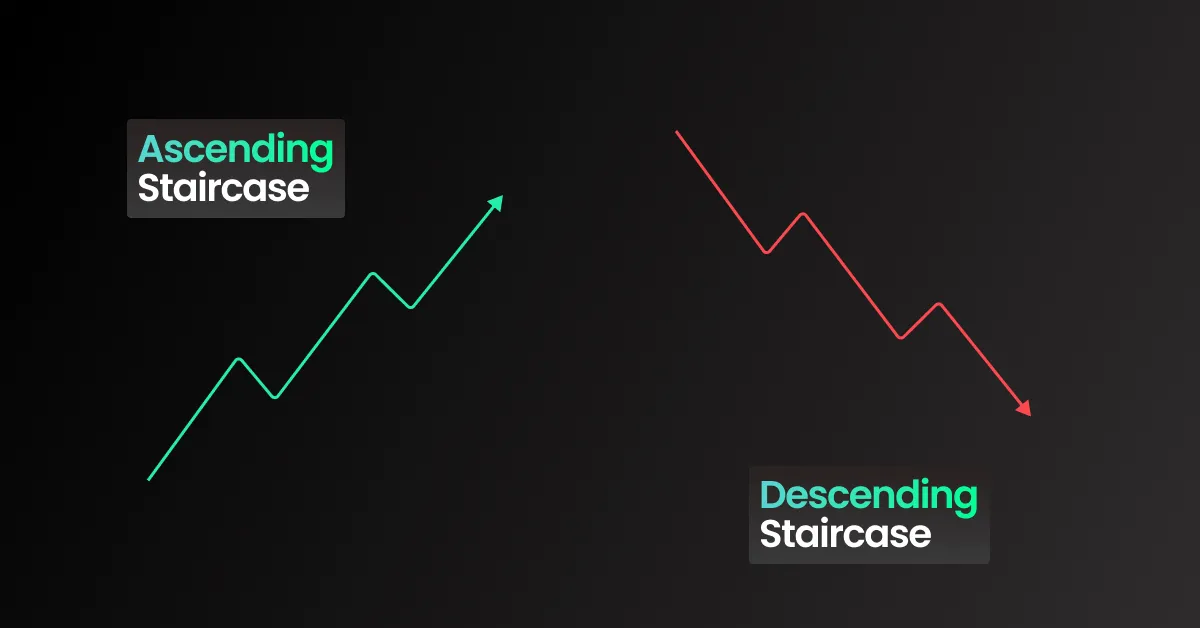
1. Ascending and Descending Staircase
The ascending and descending staircase patterns represent clear uptrends and downtrends. In an ascending staircase, prices make higher highs and higher lows, demonstrating strong bullish momentum. Conversely, a descending staircase forms when the market sets lower highs and lower lows, signaling a sustained downtrend.
These stair-step movements indicate trend strength, and traders often look for retracements within these formations as potential entry points.
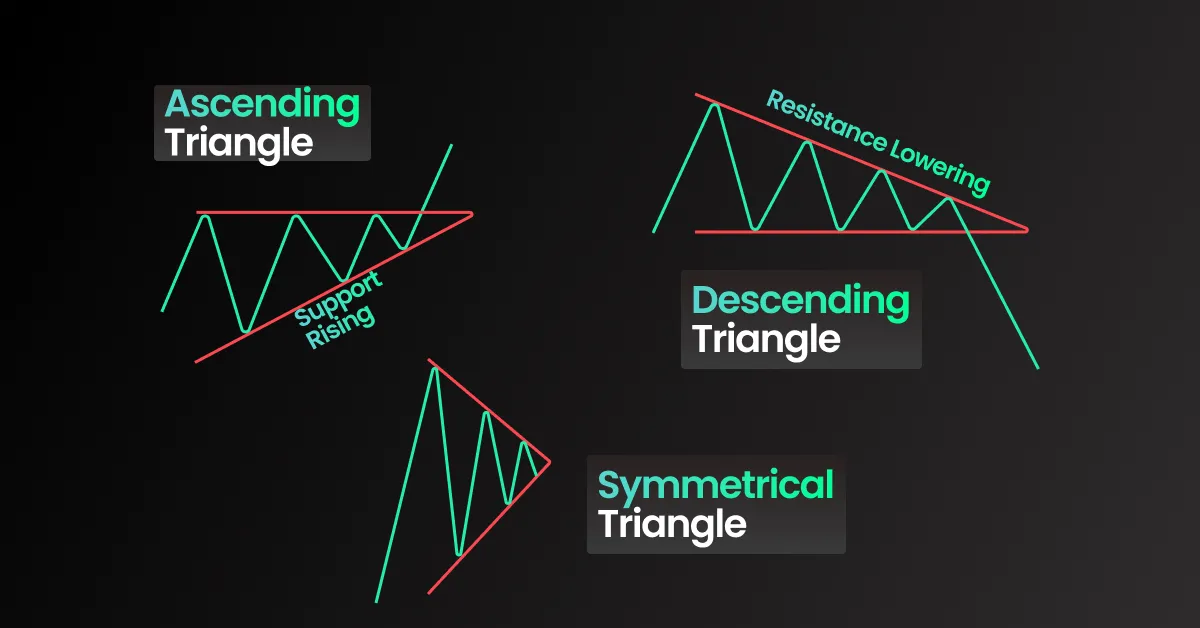
2. Ascending Triangle
An ascending triangle is a bullish continuation pattern characterized by a horizontal resistance level and rising support. The market consolidates within this pattern before breaking out, typically in the direction of the prevailing trend.
Volume often plays a key role in confirming an ascending triangle. A breakout accompanied by an increase in trading volume reinforces the likelihood of an upward move.
3. Descending Triangle
A descending triangle is the bearish counterpart to the ascending triangle. It forms when a market’s price experiences lower highs while maintaining a steady support level. This pattern suggests increasing selling pressure, often leading to a breakdown below support.
As with ascending triangles, declining volume within the pattern, followed by a sudden spike during the breakout, can confirm the strength of the move.
4. Symmetrical Triangle
A symmetrical triangle forms when price movement contracts, creating converging trendlines. Unlike ascending or descending triangles, this pattern does not indicate a clear direction until a breakout occurs.
Depending on market conditions, symmetrical triangles can serve as continuation or bilateral patterns. Traders often wait for a decisive breakout before confirming the next trend direction.
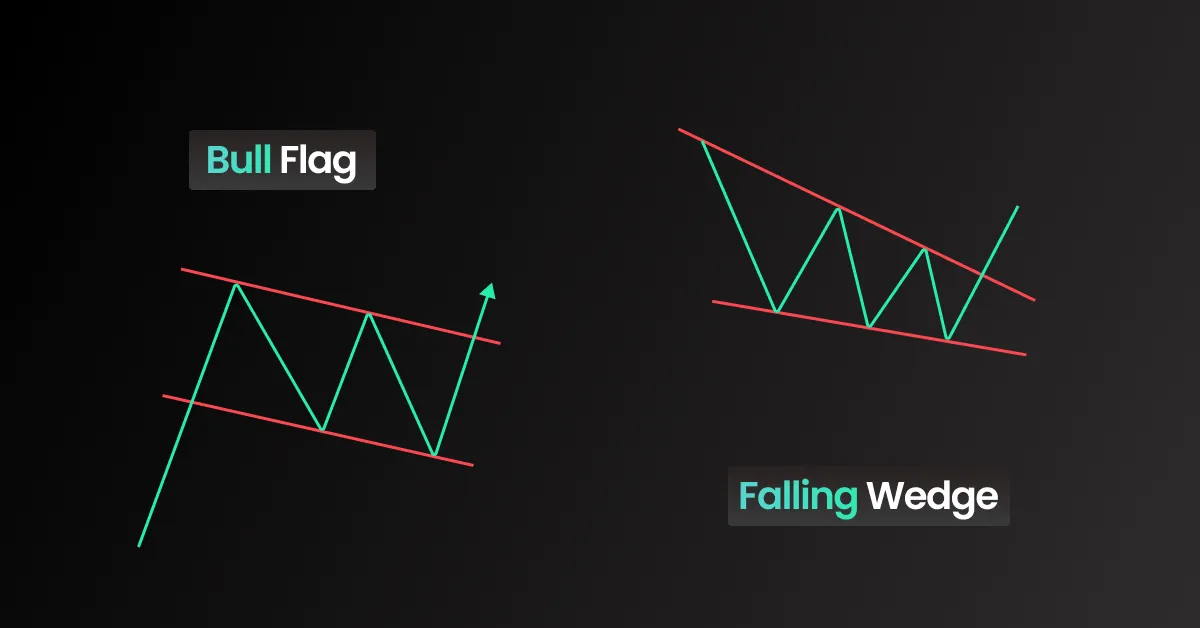
5. Flag Pattern
The flag pattern is a short-term continuation pattern that follows a strong directional move. It consists of a small, counter-trend consolidation before the market resumes its previous direction.
- Bullish Flag: Appears after an uptrend, with downward-sloping parallel lines before an upward breakout.
- Bearish Flag: Forms during a downtrend, with upward-sloping parallel lines before a downward breakout.
Flags indicate temporary pauses in momentum, providing opportunities for traders to re-enter the market in the direction of the dominant trend.
6. Wedge Pattern
A wedge pattern occurs when price movement contracts within converging trendlines that slope in the same direction.
- Rising Wedge: A bearish pattern signaling a potential trend reversal downward.
- Falling Wedge: A bullish pattern indicating a possible upward breakout.
The pattern often corresponds with declining trading volume, confirming the possibility of an imminent breakout.
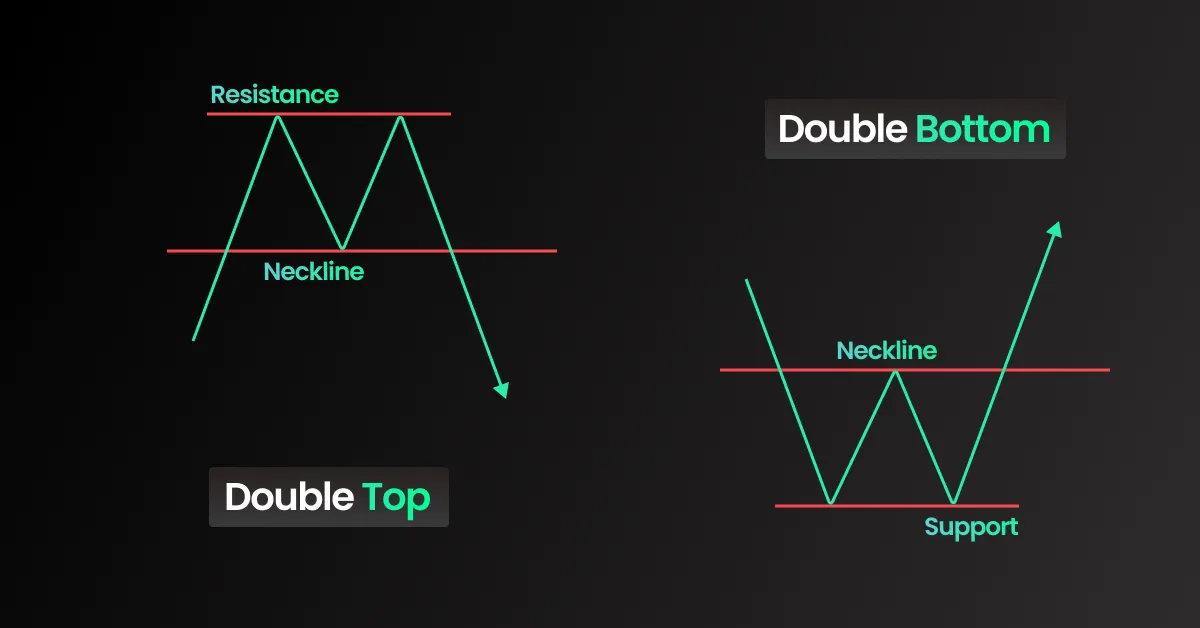
7. Double Top and Double Bottom
- Double Top: A bearish reversal pattern that forms after a strong uptrend. Two peaks form at a similar level before the price declines, indicating a shift from buying to selling pressure.
- Double Bottom: A bullish reversal pattern occurring at market lows. It consists of two troughs, signaling a potential trend reversal to the upside.
These patterns are widely recognized as key indicators of market reversals.
8. Head and Shoulders
The head and shoulders pattern signals a trend reversal and consists of three peaks:
- The highest peak (head) in the middle
- Two lower peaks (shoulders) on either side
- A neckline acting as a support level
When price breaks below the neckline, it suggests a bearish reversal. Conversely, the inverse head and shoulders pattern signals a bullish reversal.
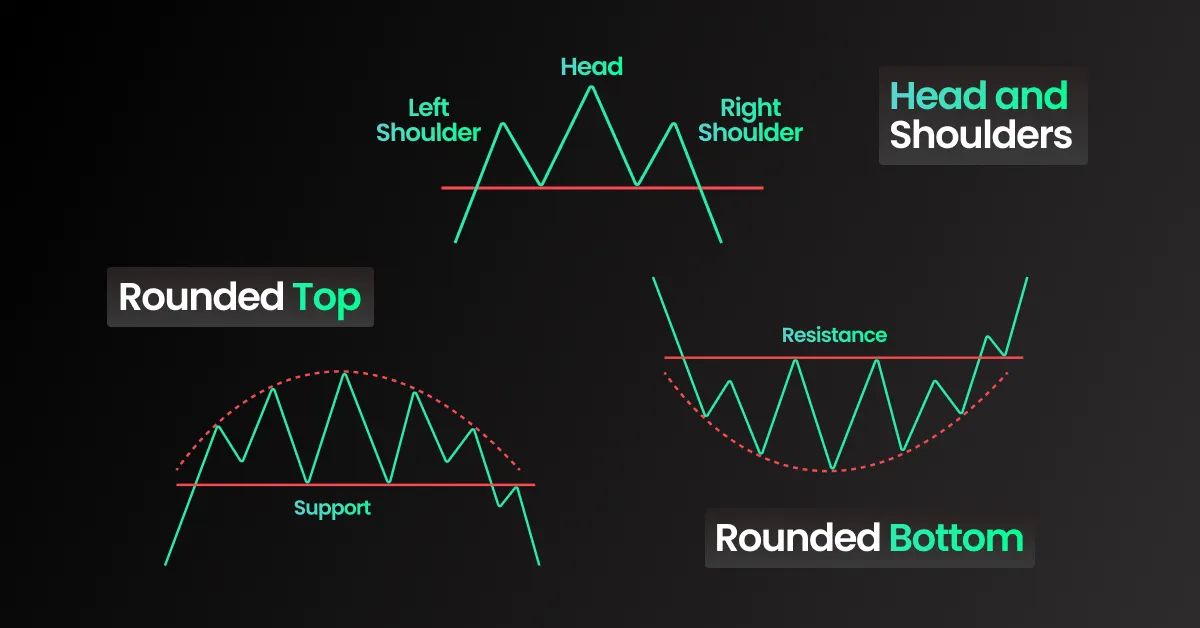
9. Rounded Top and Rounded Bottom
A rounded top (bearish) and rounded bottom (bullish) form over a longer period, signifying gradual trend reversals. Unlike sharp V-shaped reversals, these patterns indicate a slow transition from buyers to sellers or vice versa.
A rounded top warns of decreasing momentum before a potential downtrend, while a rounded bottom suggests strengthening demand leading to an uptrend.
10. Cup and Handle
The cup and handle pattern resembles a rounded bottom, followed by a small downward retracement (the handle). It is a bullish continuation pattern that often appears before a breakout to the upside.
The formation indicates a consolidation phase before renewed buying pressure pushes prices higher.

11. Diamond Pattern
A diamond pattern is a rare but significant formation that signals major market movements. It begins as a broadening formation and contracts into a tighter range, indicating increased volatility before a breakout occurs.
Traders closely monitor these patterns, as they can lead to sharp price movements in either direction.
Conclusion: Mastering Chart Patterns
Understanding chart patterns is a crucial aspect of technical analysis. These formations provide traders with insights into market psychology and potential price movements.
For more insights, visit our trading tips and start refining your trading strategies today!
