Ever wondered how professional traders seem to predict market moves with uncanny accuracy? The secret often lies in understanding market cycles and the behavior of “smart money”—the big institutional players driving price action. One of the most time-tested frameworks for decoding these cycles is the Wyckoff Method, developed by Richard D. Wyckoff in the early 20th century. Whether you’re trading forex, stocks, or even cryptocurrencies, the Wyckoff Method offers a systematic way to identify trends, spot reversals, and time your trades with precision. In this beginner’s guide, we’ll break down what the Wyckoff Method is, its core principles, and how you can start using it to trade smarter. Want to take your skills further? Check out our advanced Wyckoff strategies for precision trading techniques. Let’s get started on your journey to mastering market cycles!
What Is the Wyckoff Method?
Quick Definition: The Wyckoff Method
The Wyckoff Method is a technical analysis framework that helps traders understand market cycles by analyzing price action, volume, and the behavior of institutional investors, often called “smart money.
At its core, the Wyckoff Method is about decoding the intentions of large players in the market—those institutional investors who move prices with their massive buying and selling. Richard Wyckoff, a Wall Street trader and educator, developed this method after observing how these “smart money” operators consistently outsmarted retail traders. He called this collective force the “Composite Man,” a metaphorical figure representing the coordinated actions of big institutions. Wyckoff believed that by studying price and volume patterns, traders could align their trades with these powerful players, riding the waves of their campaigns rather than getting caught in their traps. The method revolves around three fundamental laws and a four-phase market cycle, which we’ll explore next. Ready to uncover the principles that have guided traders for over a century?
The Three Fundamental Laws of the Wyckoff Method
The Wyckoff Method is built on three core laws that explain how markets move and how traders can interpret these movements. Understanding these laws is key to applying the method effectively.
- Law of Supply and Demand: This is the engine of the market. When demand exceeds supply, prices rise; when supply exceeds demand, prices fall. Wyckoff emphasized analyzing price and volume to gauge this balance. For example, if prices are rising on increasing volume, it signals strong demand—potentially a good time to buy.
- Law of Cause and Effect: Every significant price move (the effect) has a buildup period (the cause). This buildup often happens in trading ranges during accumulation (buying) or distribution (selling) phases. The longer the buildup, the larger the potential move. Think of it like a spring coiling before it releases.
- Law of Effort vs. Result: This law compares the effort (trading volume) to the result (price movement). If there’s high volume but little price movement, it might indicate absorption by smart money—often a sign of an impending reversal. For instance, a stock rallying on low volume after a big run might be losing steam.
These laws form the foundation of Wyckoff’s approach, helping traders read the market like a story of supply, demand, and institutional intent. Now, let’s see how these laws play out in the market cycle.
The Wyckoff Market Cycle: Four Phases to Understand
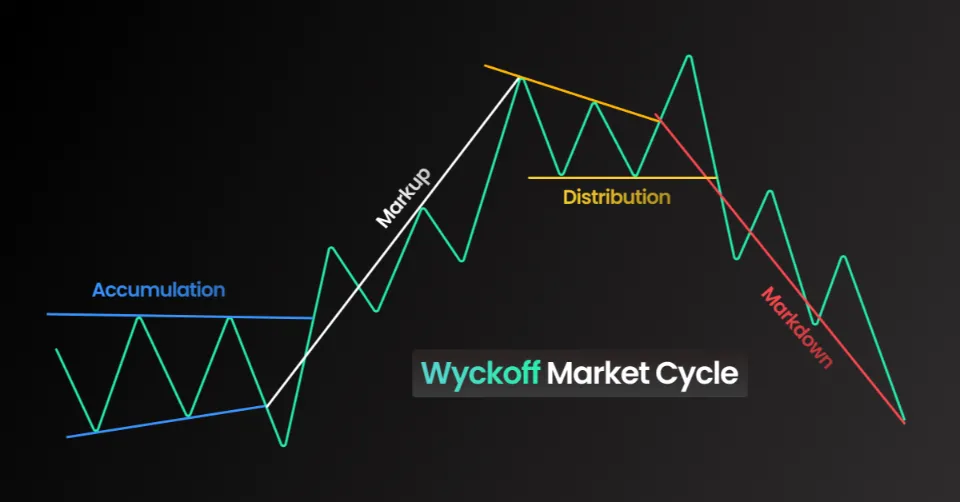
The Wyckoff Method frames market movements as a repeating cycle of four distinct phases: accumulation, markup, distribution, and markdown. Each phase reflects the behavior of smart money and offers clues about where prices are headed next.
- Accumulation Phase: This is where smart money starts quietly buying a stock or asset at low prices after a downtrend. The price often moves sideways in a tight range, with higher lows forming as buying pressure builds. For example, imagine a forex pair like EUR/USD consolidating between 1.0500 and 1.0600 after a decline—smart money might be accumulating here.
- Markup Phase: Once smart money has built a sizable position, they push prices higher, sparking an uptrend. This phase is marked by rising prices and increasing volume as retail traders jump in, driven by FOMO (Fear of Missing Out). In our EUR/USD example, the pair might break above 1.0600 and rally toward 1.1000.
- Distribution Phase: At the peak, smart money begins selling their positions to latecomers. The price moves sideways again, often with high volume but little upward progress, signaling that selling pressure is matching buying interest. If EUR/USD stalls between 1.1000 and 1.1100 with heavy volume, it might be in distribution.
- Markdown Phase: Once distribution is complete, smart money drives prices down, starting a downtrend. This phase sees falling prices and often increasing volume on down days as retail traders panic-sell. EUR/USD might drop back toward 1.0700 as the cycle completes.
Understanding these phases helps you anticipate market turns. For instance, buying near the end of an accumulation phase can position you for the markup, while shorting at the end of distribution can let you profit from the markdown. To manage your risk during these phases, explore our guide on risk management in trading.
How to Trade with the Wyckoff Method
Wyckoff outlined a practical five-step process to apply his method to trading. Let’s break it down in a clear, actionable table to help you make informed decisions.
| Step | Action |
|---|---|
| 1. Determine the Market’s Trend | Analyze the overall market (e.g., S&P 500) to see if it’s trending up, down, or sideways. Use bar or candlestick charts to assess supply and demand. Is the market in accumulation (preparing to rise) or distribution (preparing to fall)? |
| 2. Select Assets in Harmony with the Trend | In an uptrend, pick assets stronger than the market—those showing accumulation or breakouts on high volume. In a downtrend, look for assets in distribution, poised for a markdown. |
| 3. Identify Assets with a “Cause” | Look for a buildup (cause) that matches your profit target (effect). A long accumulation range suggests a big upward move. Use Point-and-Figure (P&F) charts to estimate price targets based on the range’s width. |
| 4. Assess Readiness to Move | Check if the asset is ready to break out. In accumulation, look for a “spring” (false breakdown below support that reverses) or higher lows. In distribution, watch for an “upthrust” (false breakout above resistance). |
| 5. Time Your Entry with the Market | Enter when the broader market confirms the move. For example, if the S&P 500 breaks out of accumulation, buy assets showing similar patterns. Place a stop-loss on the opposite side of the range to manage risk. |
Let’s apply this to a hypothetical trade: Suppose you’re trading a stock that’s been in an accumulation range between $40 and $42 for weeks. You notice higher lows and increasing volume—a sign of smart money buying (Step 4: Readiness to Move). The stock breaks above $42 on high volume, and the broader market (S&P 500) is also trending up (Step 1: Market Trend, Step 5: Time Your Entry). You confirm the stock is in harmony with the trend (Step 2) and has a cause for a big move (Step 3), projecting a target of $48 using P&F charts. You buy at $42.50, set a stop-loss at $39.50 (below the range), and aim for $48. As the stock enters the markup phase, you exit near $48 when volume spikes but price stalls, signaling potential distribution.
Why the Wyckoff Method Still Works Today
The Wyckoff Method has been around for over 100 years, yet it remains relevant because it focuses on timeless principles: supply, demand, and human psychology. While Wyckoff developed it for stocks, traders now apply it to forex, commodities, and even cryptocurrencies, as the behavior of smart money is universal across markets. However, there are challenges. Some argue that modern markets, with algorithmic trading and hidden volume (e.g., dark pools), make it harder to read volume accurately. Additionally, the method can be subjective, requiring practice to master. Despite these limitations, combining Wyckoff with modern tools like order flow analysis or heatmaps can enhance its effectiveness, giving you a clearer picture of institutional activity.
FAQ: Common Questions About the Wyckoff Method
Can I use the Wyckoff Method for day trading?
Yes, but it requires experience. The method works best on longer timeframes (e.g., daily or weekly charts) where accumulation and distribution patterns are clearer. Day trading with Wyckoff demands quick pattern recognition and a deep understanding of intraday dynamics.
What markets can I apply the Wyckoff Method to?
Any freely traded market where institutional players operate, including forex, stocks, commodities, and cryptocurrencies. The principles of supply and demand are universal.
How do I spot accumulation and distribution phases?
Look for sideways price action with specific clues: accumulation often shows higher lows and increasing volume on up days, while distribution shows stalling prices with high volume and signs of selling pressure.


