Technical analysis is a powerful tool used by traders and investors to predict price movements based on historical market data. By examining price charts, indicators, and patterns, traders can make informed decisions about entry and exit points. Unlike fundamental analysis, which evaluates economic factors, technical analysis relies purely on price action and volume to assess market behavior.
What is Technical Analysis?
Technical analysis is a trading methodology that evaluates past market data, primarily price and volume, to forecast future price movements. It operates on the assumption that historical price trends tend to repeat due to market psychology and behavior. Traders use this approach to identify potential trading opportunities and manage risk effectively.
The key principles of technical analysis include:
- Market Prices Reflect All Information – Prices incorporate all known factors affecting an asset, making fundamental analysis secondary.
- Prices Move in Trends – Markets follow identifiable trends, whether upward, downward, or sideways.
- History Repeats Itself – Investor behavior follows patterns, which repeat over time, allowing traders to predict future movements.
- Volume Confirms Trends – Trading volume plays a crucial role in confirming trends and breakouts, reinforcing the strength of price movements.
Why Technical Analysis is Important?
Technical analysis provides a data-driven approach to trading, removing emotional bias. It allows traders to:
- Identify market trends
- Determine optimal entry and exit points
- Assess risk-reward ratios
- Understand market sentiment
By utilizing various tools such as trading indicators, price action analysis, and chart patterns, traders can enhance their decision-making processes.
Key Components of Technical Analysis
1. Price Charts
Charts are the foundation of technical analysis. They provide a visual representation of market activity and help traders spot trends, support, and resistance levels. The most commonly used types of charts include:
- Line Charts: Display closing prices over time.
- Bar Charts: Show the open, high, low, and close prices for a given period.
- Candlestick Charts: Provide more detailed price movement insights, including bullish and bearish formations.
2. Trading Indicators
Indicators help traders analyze price movements and identify potential trade opportunities. Some widely used indicators include:
- Moving Averages (MA): Smooths out price data to highlight trends.
- Relative Strength Index (RSI): Measures the speed and change of price movements to identify overbought or oversold conditions.
- MACD (Moving Average Convergence Divergence): Identifies trend direction and strength.
- Bollinger Bands: Indicates market volatility and potential reversal points.
3. Chart Patterns
Chart patterns form due to repetitive market behavior and signal potential price movements. Key patterns include:
- Head and Shoulders: Signals a reversal in the current trend.
- Double Top and Double Bottom: Indicate trend reversals at significant support or resistance levels.
- Cup and Handle Pattern: A bullish continuation pattern suggesting upward momentum.
- Flags and Pennants: Short-term continuation patterns in strong trends.
4. Support and Resistance Levels
Support and resistance levels are critical in technical analysis as they mark price points where markets tend to reverse or consolidate.
- Support: A price level where demand is strong enough to prevent further declines.
- Resistance: A price level where selling pressure prevents further increases.
Traders use these levels to set stop-loss orders and define entry/exit strategies.
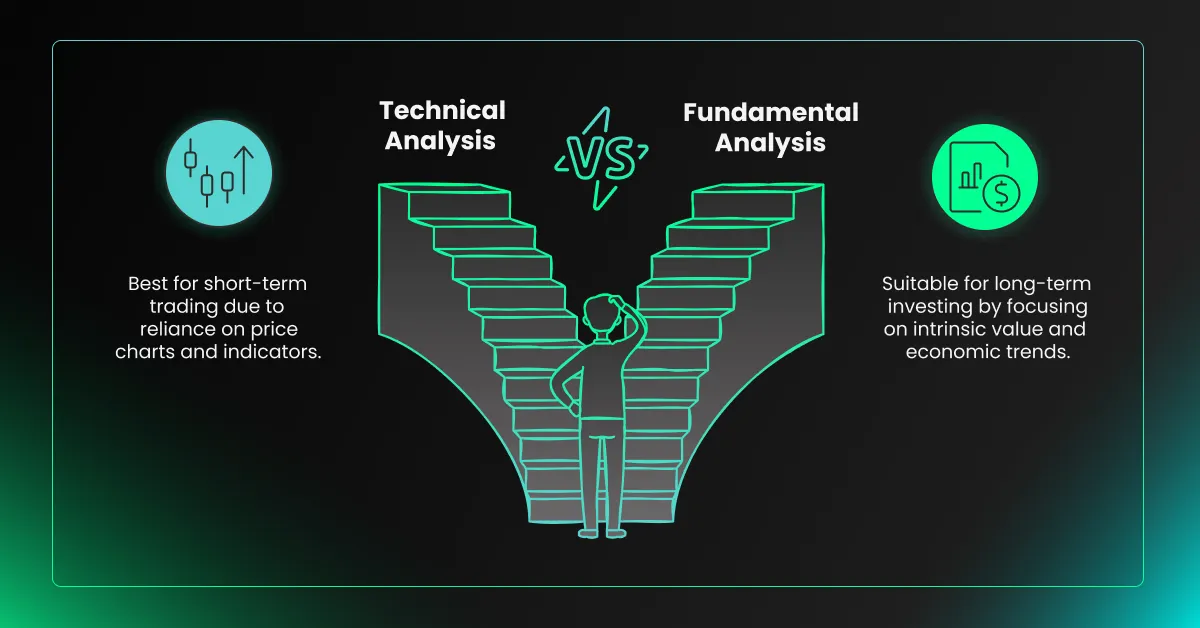
Technical Analysis vs. Fundamental Analysis
While technical analysis focuses on price action, fundamental analysis examines economic data, earnings reports, and financial statements. The key differences include:
- Technical Analysis: Relies on charts, indicators, and historical price data.
- Fundamental Analysis: Focuses on intrinsic value, company earnings, and macroeconomic trends.
- Best Use Case: Technical analysis is ideal for short-term traders, while fundamental analysis suits long-term investors.
Common Mistakes in Technical Analysis
While technical analysis is valuable, traders often make avoidable mistakes, such as:
- Overcomplicating Analysis: Using too many indicators can create conflicting signals.
- Ignoring Market Context: Failing to consider economic news and fundamental events can lead to poor decisions.
- Neglecting Risk Management: Every trade should have a stop-loss to minimize losses.
- Blindly Following Patterns: Not all chart patterns guarantee successful trades; confirmation with volume and other indicators is necessary.
Final Thoughts on Technical Analysis
Technical analysis is a cornerstone of modern trading, helping traders anticipate price movements and execute well-informed strategies. By mastering trading indicators, price action analysis, and chart patterns, traders can enhance their market understanding and increase their chances of success.
Q&A for Technical Analysis
1. What does technical analysis mean?
Technical analysis is a method used by traders to analyze historical price movements and trading volume to predict future price trends. It is based on the assumption that market trends repeat over time due to investor behavior. Traders use price charts, indicators, and patterns to identify opportunities, determine entry and exit points, and assess overall market sentiment.
2. Is technical analysis enough for trading?
While technical analysis is a powerful tool, it is not always sufficient on its own for making trading decisions. Successful traders often combine technical analysis with fundamental analysis, which considers economic factors, news events, and financial reports. Additionally, risk management strategies are essential to mitigate market uncertainties, as no method guarantees 100% accuracy in predictions.
3. What are the four basic principles of technical analysis?
The four basic principles of technical analysis include:
- Market Prices Reflect All Information – All known factors, including economic data, news, and trader sentiment, are already factored into the price.
- Prices Move in Trends – Markets follow identifiable trends, whether bullish, bearish, or sideways, allowing traders to make trend-based predictions.
- History Repeats Itself – Market behavior and investor psychology cause price patterns to form repeatedly, helping traders anticipate potential movements.
- Volume Confirms Trends – Trading volume plays a crucial role in confirming trends and breakouts, reinforcing the strength of price movements.

